
Diamond in the Rough? – a series by Kevin Hetrick
2011-08-10Diamond may not be the appropriate words for these players, but I offer the following…
Last year, the Cavs had five rookies that were selected after the 52nd pick in the draft or were undrafted. Samardo Samuels, Luke Harangody, Semih Erden, Manny Harris, and Alonzo Gee (I’m counting Gee because he was undrafted and only played 180 minutes in 2009 – 2010) were draft day afterthoughts that played at least 600 NBA minutes last year. In this short series, these players will be compared to similar players from the 2002 – 2003 to 2009 – 2010 seasons to determine what precedent there is for each to become a productive NBA player.
The comparisons will be statistical and based on eight numbers: true shooting percentage (ts), assist rate (ast), turnover rate (to), usage rate (usg), offensive rebounding rate (orr), defensive rebounding rate (drr), player efficiency rating (PER) and age. Both the statistics and the timeframe were selected because they are easily sort able on ESPN.com’s “Hollinger’s Player Statistics” page.
Over the 8 seasons, the following table reflects the power forwards that were statistically most similar to Samardo Samuels last year. Samuels scored with below average efficiency, rarely passed, and rebounded offensively nearly as well as he did defensively. In some cases, the definition of “similar” gets slightly stretched.
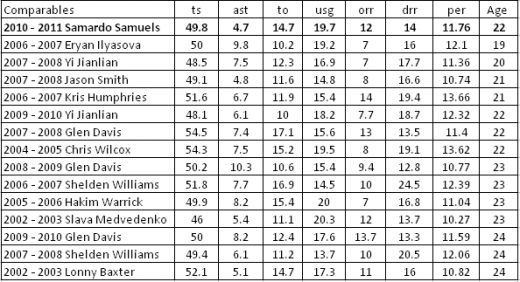
What conclusions can be drawn from this data? First, no player “similar” to Samuels has become more than a borderline NBA starter. Kris Humphries is the most intriguing, but he’s not a great comparison; Humphries was younger, more athletic, and slightly better across the board. Glen Davis is a relatively inefficient player whose reputation has benefitted due to playing on a champion.
The most similar seasons to Samuels were 2007 – 2008 Jason Smith, 2007 – 2008 Glen Davis, 2002 – 2003 Slava Medvedenko, and 2002 – 2003 Lonny Baxter. The most similar player is Davis, due to his physique and also shot distribution; Samuels attempted 79% of his field goals from inside 10 ft compared to Davis’ 77% attempted from short range in 2007 – 2008. Each of the aforementioned four players was a rookie except for Medvedenko, who did not attend college and was in his third season. The most encouraging take away is that the two more recent players are still playing and played at least 1100 minutes for a playoff team last year. During the comparable seasons, one of the four players played 900 minutes on an NBA champion (Davis) and another played 700 minutes for an NBA champion the year prior (Medvedenko). In conclusion, although there is not a precedent for Samuels to become much more than he is now, there are precedents for sustainable contributing to a successful NBA team. Hopefully like Glen Davis, someday Cavs fans are able to discuss Samuels as an inefficient back-up that benefitted from being on a champion.
(Also if anyone cares, I will be making several posts at eightpointsnineseconds.com, the True Hoop Network blog for the Indiana Pacers. The first one should be up tomorrow.)

The Nupe, Thanks for the comment, but I do disagree with you on the application of some of your points above. You allude to this, but I don’t want to weight anything, because I don’t have a definite basis for assigning the weightings. The fact the PER is to some extent a conglomerate of the other stats, makes it seem less useful for comparing players. It is useful for helping explain that player A was more efficient than player B, but not to compare the two players. I did use it to gauge what players to look at. Looking at… Read more »
Lot’s of data/numbers, I appreciate people looking at and doing analysis like this. A great attempt to make since of things and you should be commended. I don’t refute anything you say, and based on just watching Samardo play, I think he can be a decent back-up in the NBA. I won’t be surprised if he’s playing in Europe in a few years. What I would say about the data analysis presented is that I’m not sure if all componets looked at matter or matter with the same weight. Maybe per, should be weighted most heavily (say 3X) followed by… Read more »