

Stat Stats: Do the Cavs lack a Killer Instinct?
2016-02-19
Stat, from the latin statim for “immediately”,
Stats, as in statistics.
The impetus for the first ever “Stat Stats” post is a comment from Raoul in today’s Recap.
Do you have any stats showing the Cavs have a bigger “maddening ability to take the foot off the gas and let their opponents back into games” than any other team?
News flash: The other team is also trying to win! Have you heard the expression “Everyone makes a run in the NBA”? As long as anyone has played basketball, most games are a series of back and forth runs. When the other team makes a run, that does always mean someone took their foot off the gas. That is the way basketball goes.
Certainly, anyone who has ever played basketball can appreciate that:
1.) As one team increases its lead in a game, its sense of urgency naturally decreases as a function of the lead.
2.) As one team gets further in the hole, its sense of urgency naturally increases as a function of a lead.
3.) As one team starts to get blown out, its incentives may switch from trying to win to trying not to get embarrassed.
4.) As one team starts to, ahem, blow out another team, its incentives may switch from trying to continue blowing out versus trying to rest its stars or avoid injuries.

Any way you slice this, there are natural forces that tend to push NBA game scores towards somewhat even affairs. Another way to think about it is, in games that regularly feature combined scoring around 200 points, a 10 point differential in the final score is considered a blowout. Or, playing roughly 10% better than your opponent over 48 minutes is considered dominance of sorts. I can best describe this phenomenon by a running joke I have with a buddy who doesn’t follow basketball much. Whenever I invite him over to watch he lets me know he’ll come by for the last five minutes when the game is sure to be tied.
I do get the sense this season that the Cavs have trouble slamming the door on opponents, more so than they should at least. So I decided to investigate a little bit.
I found two imperfect ways to look at this. The first is easy to digest. I subtracted each team’s Point Differential (or, average score at the end of the game) with that team’s Average Largest Lead. This is probably a more meaningful comparison between good teams that win most of their games. As for terrible teams, the worst they can do is have a largest lead of 0 (right at tipoff). It can’t get any worse and most big leads by bad teams happen very early and are partially random.
The second way to look at this is to arbitrarily define a “team is comfortably ahead” threshold and compare the plus/minus of each team after it has exceeded that threshold. Or, how much quote unquote killer instinct does your team have? When you are up 10, do you hang on, build a lead, bleed it away, or quickly succumb to boredom? NBA.com provides in-game splits based on point differential. So I chose being ahead at least six points (a 2 possession game), and compiled the plus/minus for each of the top teams in the league when that condition is met.
Be….sure….to…drink…your….RAPM?
First Approach Results: The Cavs have an average largest lead of 15.5 points. Their point differential is 6.0. That’s a drop of 9.5, or the 6th smallest drop behind: LAC, TOR, GSW, OKC, SAS. That smells right, considering the Cavs are 4th in SRS. Nothing too interesting here.
Second Approach Results:
SAS: +3.5 PPG
GSW:-0.4 PPG
OKC: -5.3 PPG
CLE: -8.9 PPG
BOS: -10.1 PPG
TOR: -14.1 PPG
LAC: -15.3 PPG
This is a little more interesting. The Cavs get outscored at a rate of -8.9 points per game in situations when they are ahead by at least six points. I compared them to the other top six teams in the NBA (according to SRS). As you can see above, the Thunder bleed points away at a rate of -5.3 per game, while the Warriors basically play to a draw (-0.4). The Spurs, meanwhile, outscore opponents by 3.5 points per game anytime they are already ahead by at least 6 points. Clearly, they are the ultimate Killer Instinct team.
Looking at the results, it’s a little bit hard to grasp what exactly is happening. How can the Warriors, with a point differential of +12.5 have a slightly negative point differential when ahead by six points??? Well, it has to do with the way you are classifying the events. I’ve provided an example:
Imagine a team up 5-0. Then, that team hits a 3 to go up 8-0. (Only now is the greater than or equal too +6 condition valid, so put a mental marker at +8.) After a wild sequence of runs in both directions, the opposing team claws their way back to a six point differential, at say, 33-27. At this point, the winning team has been ahead by at least 6 points for almost the entire game, and yet, their plus/minus would register at MINUS TWO because they didn’t begin to be “ahead by at least 6” until after the 3 pointer to put them at +8. (6-8 = -2) Now, the opposing team hits ANOTHER TRIPLE to bring the game within one score at 33-30. This shot was attempted while the winning team was ahead by at least 6, so it counts in the plus/minus aggregation. Therefore, the winning team has a plus/minus of MINUS FIVE (3-8 = -5) during all moments of the game when they were ahead at least six points. See how this is kind of weird? It is more intuitive to think: “If a team creates enough of a lead to get above the +6 threshold and eventually loses it to get out of the +6 threshold then its plus/minus throughout those sequences evens out to zero. But that’s not the way it works as you can see in the example.
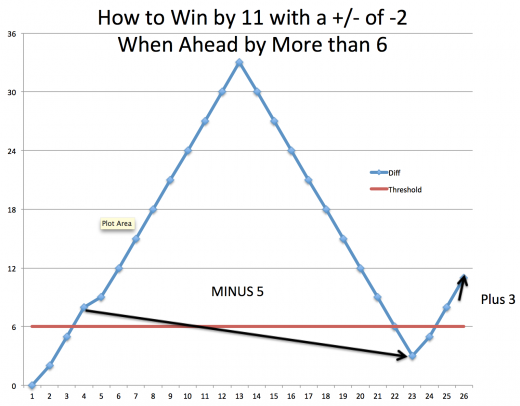
The crowd is getting restless. The winning team’s superstar steals the ball and throws down a dunk, making the score 35-30. Then Delly (he’s here now) steals the inbounds pass and drains a no-hesitation 3 to put the winning team up 38-30. One more stop + another bucket will put the game out of reach. Delly fronts the 10’7” MonSTAR, forcing the turnover. He finds J.R. Smith who takes a triple pump, stanky-leg, falling out of bounds 3-pointer. BANG! The good guys go up 41-30 and the game ends because Chuck Norris rushes the court and roundhouse kicks all the MonSTARS back from whence they came. Now, the winning team didn’t go back UP by more than six until AFTER Delly’s no-hesitation 3. So only the stanky-leg triple counts in the plus/minus when the winning team was up at least 6. So, even though the final score, 41-30, contributed to a +11 for the winning team, that team actually posted a MINUS TWO when leading by at least 6 points. Hopefully that sheds some light on the values. Here’s a graph to demonstrate the story I just made up.
Neither of these methods are great. Ideally, you would want to isolate garbage time, which is going to factor in greatly here. I don’t have a way to do that (yet). But I suppose Raoul has an appropriate perspective that all teams give up big leads. That said, the numbers here are congruent with the theory that the Cavs lack a killer instinct. But those numbers don’t prove that the Cavs are any better or worse than similarly ranked teams when it comes to SRS. (Raoul’s point, I think.) That said, the lack of the killer instinct would contribute to a lower SRS….so…I’m gonna go out on a limb and say that, yeah, I’ve found nothing to change my belief that the Cavs do in fact lack a Killer Instinct (although we haven’t proven anything).
When this phenomenon happens (the whole, taking the foot off the gas pedal), and against whom is probably more valuable information than what I’ve presented here. But, despite the theme of the title, this took me forever so act like it’s interesting please.

Editor’s Update: I replaced the old graph with the proper one. Also, here is a list of the percentage of time a team is ahead by at least 6 points:
SAS: 50%
GSW:56%
OKC: 38%
CLE: 41%
BOS: 37%
TOR: 32%
LAC: 35%

Warriors Emerge As Favorites For Anderson Varejao: basketball.realgm.com/wiretap/240930…
I’m so pissed. The warriors, san antonio, and OKC all interested. In other words, the three best teams in the league believe he can help them. But he wasn’t good enough for us, even though we now have two empty roster spots.
By firing Blatt and trading Varejao, Griffin guaranteed he gets fired if we don’t win a ring.
We have no picks for the foreseeable future and Lebron is 31. Talk about all in.
Andy is a good enough passer, he can play a similar role to Draymond in the offense. He doesn’t have the 3-point shooting, but he can roll halfway to the basket and take the elbow jumper, or pass.
I see the biggest Cav’s mystery this year as why they did not play Andy. He looked pretty good the few times they did. I had assumed they were saving him for the playoffs. But that hardly fits with trading him. Even trying to keep him healthy for a trade doesn’t make sense if the team they traded him to cut him ASAP. We might have rested him up all year so he can make maximal impact with the GSW. That would be a bummer.
Yes, there are some scenarios with Andy and the Warriors that I don’t even want to contemplate…
Someone, maybe Arch, suggested it was partially a tax saving move. Could be true, though I do not think saving 10 million, or whatever the number, is the whole reason. Frye does provide more floor spacing. Could run out a line up of Frye and Love against GS and try to open up the lane more against that team. Also means that lineups without love will still have a stretch big. But yeah, I am terrified of the scenario you mentioned. Andy playing well for Golden State during the finals and stealing a crucial possession for them with his rebounding… Read more »
Trading Andy was 100% a tax saving move. We have two open Roster spots. We absorbed Frye in our trade exception completely. You don’t think Orlando would have taken a first instead of a second for Frye?
We gave a first rounder to Portland to take Andy’s salary. It was a 100% salary dump. For a useful player who spent his entire career with us and every single player loved. Its astounding, after all the talk and all the money spent, that they’d choose the moment when chemistry is the biggest issue to trade the longest tenured player. Its just…baffling.
That was definitely about the money. As much as Cols likes to say “Danny doesn’t care about the money”, *everyone* cares about the money, billionaires most of all. I work in a business that caters to the wealthiest people in the world, and, believe me, the only people who care more about money than multi millionaires is billionaires. That said, no way I can blame Gilbert for wanting to shed some tax money for a guy who likely was not going to play meaningful minutes in the playoffs. It’d be different if it was just the 9-10 mill – it’s… Read more »
Is Frye active for today?
Nevermind, no, he’s not. What’s the hold up?
Dave McMenamin @mcten 1h1 hour ago
Extra tests because of his enlarged heart. Team not concerned. Just a longer process than usual.
……….
This is Frye’s third season back after he sat out a full season following the original diagnosis.
According to Joe Vardon yesterday:
If the Cavs find an issue with Frye that causes the trade to be voided, they don’t get Anderson Varejao back. Varejao was traded separately to Portland in return for that second-round pick the Cavs packed to Orlando. The Blazers have already waived Varejao.
NEED OUR MAN –EVIL —TO MAKE IT -(-” MIGHTY MAC ” ) INTO A HOLLYWOOD MOVIE ( I WILL PLAY MYSELF AS THE COACH ) AND YES RAOUL HE SHOOTS WAY BETTER THAN DION
TRUST ME EVERYONE HEARD ME LAST NIGHT YELL FOR ” MIGHTY MAC ” —–I CAN’T TELL YOU HOW MUCH IT MEANS TO ME ALL THE KIND WORDS FROM MY FELLOW BLOGGERS –I WLL MAKE SURE TO PASS THEM ON TO ” MIGHTY MAC “
And, he shoots better than Dion Waiters at the rim!
THANKS SCOTCH AND TO ALL YOU FELLOW BLOGGERS WHO MIGHT HAVE VIEWED ” THE MIGHTY MAC ” —IT ISN’T ALWAYS ABOUT WINS AND LOSSES !!!
Nomad, they missed the boat not interviewing you! And deprived us of hearing what you sound like speaking in all caps!
THANK YOU TOM –YES THAT IS OUR “STAR MAC ” THANK YOU FOR ALLOWING ME TO SHARE ON THIS BLOG ( ALSO THE BALDING COACH IN THE ALL WHITE SUIT IS MY SHORT GLIMPSE OF FAME )
ALSO SAW THE MOVING SPEECH OF MONTY’S !!!——THESE ARE ALL THE POSITIVES OF BEING INVOLVED IN SPORTS !!
What a special way to honor Mac Stephenson’s commitment to the team, Nomad! So great that stuff like that makes the news. Reminds people the world is full of as much good as it is full of less than great. Also, Mac ought to be hired by the Cavs to show our guys how to use te square on layups. Textbook form!
Warriors are doing their due diligence on Anderson Varejao, but you have to wonder if the if-it-ain’t-broke-don’t-fix-it rule doesn’t apply — Sam Amick
David Lee To Sign With Mavericks For $2.1M Room Exception (via @ShamsCharania): basketball.realgm.com/wiretap/240919…
I think he’ll actually get some PT on the Mavs too.
Monty Williams’s wife recently died in a car crash. He delivers this profound eulogy at her funeral. It was shown on ESPN, NBA.com, SI, People magazine, and many other media outlets. For those interested:
(7 minutes)
I haven’t watched that yet but I will. I also recommend watching Father Paul Scalia’s homily at his Dad’s funeral today especially if you are Catholic regardless of how you feel about Scalia. Pretty remarkable. Maybe the best thing I’ve ever heard at a funeral
I updated the graph. Now it makes sense.
Have you guys seen this? For all you C:tB’ers who have kids. I hope this is how my kids are, also this is pretty much how I felt: http://espn.go.com/video/clip?id=espn:14809596
yeah I saw that. That was me when my Dad told me the Cavs traded Mark Price. Although I was in 6th grade.
That was so touching. Notice how the kid then asked, “Did they trade LeBron or Kyrie too?” He is a future CtB commentator, that’s for sure.
WITH TEHE RECENT TRADING OF A.V. THERE HAS BEEN PLENTY OF “PAIN OF SAYING GOODBYE ” LAST NIGHT / SENIOR NIGHT ( FOR THE THE HIGH SCHOOL TEAM I COACH ) HAD TO SAY GOOD BYE TO 6 OUTSTANDING SENIORS WHO HAVE ACCOMPLISHED GREAT THINGS— ONE OF THOSE SENIORS HAS DOWN SYNDROME ( AND HAD NEVER PLAYED–WAS ARE MGR FOR 6 YRS )—-LAST NIGHT HE PLAYED / SCORED THE 1 ST BASKET AND THE JAM PACKED CROWD ERUPTED !!!!—-I AM STILL WIPING AWAY THE TEARS ——THESE ARE THE JOYS ( AND SORROWS ) THAT HAVE KEPT ME COACHING FOR 30… Read more »
Very nice, Nomad. Those moments as a coach are indeed special.
Thats great Nomad, sounds like a good place
Wow. That is incredible. Did anyone capture any of that on video? I wanna see it. Great job, Coach Nomad!
NOMAD – is this your team? http://www.13abc.com/home/headlines/Teams-come-together-to-make-players-dream-come-true-369522581.html
That vid sure describes Nomad’s story. I think that must be Nomad’s team.
Bill Simmons has tried to convince Utah fans to send Hayward to Boston, for Boston garbage.
Funny how it’s always their garbage, and not much of it, that they want to send? Shocking that teams haven’t sent them Durant, Anthony Davis et al for their trash. I mean, it’s only right that every other team should send the Celtics their stars for absolutely nothing.
Kind of don’t expect Shump to play tomorrow.
GS plays the Clippers tomorrow. Maybe they’ll start their first losing streak.
It’s a road game, so it’s possible. No Griffin will make it tough.
Clippers have played better without Griffin this year.
I don’t buy it. They have a good record without him. I don’t think there’s any way they play those early games against GS so close without Griffin….he was pretty key in those games, even though they lost.
I think they’re a better team with Blake. But there win/loss record has been better without him during this stretch.
They just beat the Spurs by 19 on Thursday night!
Jon Barry just talked about watching Avery Bradley in 2009 finals, and how he couldn’t shoot. Avery Bradley was drafted in 2010. The Celtics were not in the 2009 Finals either.
Good news, Celtics also losing pretty big. And the Nets won. Love it.
Que the Simmons hate-cast.
He’ll just spew out some childish tweets…
He’s gotta get his lapdog Chris Ryan to join him.
The Magic would be a good team for Blatt to coach. They should fire Skiles and hire Blatt.
Warriors clearing throwing this game. Couldn’t let the Cavs one up them against the Blazers.
OKC lost to Indy also. They’ll be fired up for Sunday.
And we all know how the Cavs perform on two days rest…
Portland up 8 on GSW late in the third. I am starting to like the second half of the season!
Wow they’re up 25 at the end of the 3rd.
Ya apparently the dubs are still stuck in all star game mode. No defense from them tonight.
This will force them to sign Varejao.
Andy must be playing for Portland tonight!
The start of “The curse of Andy Varejao”!
I wish I was watching this one….I’d relish it. Lillard is torching them.
Steve Kerr is in trouble!
The players are ignoring Kerr, and going to Walton….and Green just sat in Kerr’s chair. Mouthed the words, “This is b******t!!”
Yo! McDermott and Rose had big nights, and the Bulls beat the Raptors.
How did you find those splits on NBA.com? I loved this idea, I just wanted to play around with how the differential changes when ahead by 7+ pts (3 pos) or under 3pts?
I use a media credentialed nba.com portal.
I think you can find the same stuff on stats.nba.com it’s just displayed differently.
Try this
http://stats.nba.com/team/#!/1610612739/stats/?t=cavaliers&Season=2015-16&SeasonType=Regular%20Season&Split=ingame
It’s easier to compute if you select “Totals”
http://stats.nba.com/team/#!/1610612739/stats/?t=cavaliers&Season=2015-16&SeasonType=Regular%20Season&Split=ingame&PerMode=Totals
Those stats back up another common thought… The Cavs are at their best in two different parts of the game for two different reasons. When down 6-10 points, their defense locks up as well as anyone (the let’s stop messing around area). And when up 1-5 points, their offense blows people away (the relaxed but still focused area). I wonder if these splits would even out a bit in the playoffs when everyone’s yelling about every possession being crucial?
NBA.com bins them with less granularity than you like.
Awesome! Thanks a lot! It isn’t as precise as I thought, but that’s still cool to see conventional wisdom hold up as the plus-minus keeps going down as deficit shrinks and then the lead grows.
Warriors must be revolting tonight for the bench scrubs against Portland so far…
https://goo.gl/photos/dJfKdg6QKjcwThnB8
Gift for my birthday from the in-laws.
First time to post again since the Andy trade. I guess I’ll just share the sentiments of others. We all wish you the best Andy. That letter was so emotional btw.
I am with you. And, if Cols says anything obnoxious, we should make him go back and sit at the children’s table for the rest of the year!
I love this post by the way. You discovered absolutely nothing. You merely pointed to a theory tested it. The tests proved inadequate and you just decided to post it for discussions sake. Props
Thanks Rodney
i appreciate that a lot.
That’s a great point and a great reminder, particularly as we get into the political season: A scientific test cares not for the result. If the method is pure, you accept whatever it tells you, even if it tells you nothing, whether your initial theory was right, wrong, or neither. Appreciate the time spent to look it up and test something and posting the results. Still good science.
I think some more light would be she’d on these stats, say, from 4 minutes into the second quarter to 4 into the 4th. It wouldn’t be completely accurate, and would still contain some of the impairments from the whole-game stats, but could find more of the “got a team on the ropes, do you keep them there” idea. I don’t think the Cavs would fare well in that regard. How many 15 point leads have been made in the 2nd to be squandered in the third. This would partially negate the garbage time issue. Just a thought. Anyway, appreciate… Read more »
And if my thoughts seem scattered, I blame it solely on the Lagunitas Undercover Investigation Shut Down Ale… Getting too old for 9.5% beers…
Right now the only way I could do that is by writing some scripts that mine play by play data.
It would take a while, but I could possibly do it. (i probably wont)
It’s still hard to know from box scores only when things like garbage time set in. You can monitor wholesale substitutions…
Yeah, that would be a crap ton of work for minimum gain.
I agree – definitely wouldn’t find this type of number crunching anywhere else despite what the ultimate conclusion is. Thanks for posting this!
I don’t know how to link a tweet, but AV’s letter to fans just made me tear up a little.
Yeah, great letter from a great guy.
Super classy.
Wish they would have used him more this season.
Not sure what they saw that they felt he wasn’t worth it.
Andy got a gift contract after a bunch of tough seasons. He played so well but was hurt for more than half of 5 of the last 6 seasons. How many teams re-up a guy for $10M a year for 3 years after that? Griffin could have just let him ride the old deal and cut him especially knowing the Cavs were going to be throwing major dollars around trying to win a championship. Griffin is no saint but it’s not like they cut or traded him on a vet min. In the new cap era, some team would take… Read more »
I have to say, I absolutely loved this piece. I a fantasy world, CtB and all its posters would be paid full time to waste hour upon hour writing these types of pieces. That’s basically what Grantland and Fivethirtyeight try to do. My job sucks.
100% agreed. I do this sometimes where i have a theory try to test it and come up short. I just wish I had a blog to throw it up on and see what others think
Thanks guys – glad you appreciated the data mining.
I just now realize I spent so much time making that graph and I ended up posting the wrong one….going to update as soon as I get my laptop charged.
ESPN sources say that Golden State is among the teams contemplating a run at soon-to-be free agent Anderson Varejao — Stein
Best way to get a ring that’s for sure. At least if they beat the Cavs, I’ll feel happy for AV.
The Warriors, I’m told, are still in fact-finding mode, but are weighing the pros and cons of pursuing Varejao after he clears waivers. — Stein
I was afraid to even float this idea when he was traded. Please punch me in the face right now if Varejao wins a ring in Cleveland’s VISITORS locker room.
It would be karmic payback for Cols…
Imagine if he hit the game winning shot against the Cavs. Oh boy! Cols would need lots of Doritos to recover.
If he goes to GS, he can reunited with the Herculoids. If he goes to OKC, he can reunite with St. Weirdo. If he goes to the Spurs, he can reunited with Danny Green.
We cut Danny Green.
I go in these cycles where I forget and then re-remember.
The Mavs are also interested in AV. Cavs for Mavs connection.
I could actually see him fitting in well with that Warriors team (they are such a machine, hard to imagine too many people NOT fitting in….). He could play Speights minutes, good passer, screener, and would get easy shots. I could see the Warriors liking his fit as a bench guy who can play a few minutes if needed. Wouldn’t surprise me.
I dont think the numbers make sense, but thanks for trying to model it! Nice job!
That is a pretty interesting attempt to wring some info out of the data. Of course, not clear what it all means. There are lots of other variables involved as well. 1. Garbage time. I think the Bulls gained 9 pts in the last half minute last night. 2. Bizzarro garbage time. Sometimes a game is close, and near the end turns into a big win. Often this is because the behind team starts doing increasingly long shot things to try to pull out a miracle. 3. I think many runs are a combination of a brief expenditure of more… Read more »
Yeah these are outstanding points, Raoul. And I agree with your sentiment on the hot hand skepticism.
I wasn’t able to isolate anything the way I had hoped. Really the most interesting takeaway is how relentless the Spurs are.
I believe that the teams that continuously blowout opposing teams are the ones with great bench play and lots of long range shooters (like of course the Warriors and Spurs).
The Cavs don’t have a good scoring bench and the only 3 point threats for the Cavs are JR (and he is kind of streaky) and hopefully KI will find his range soon.
The Cavs need the 3 ball more, let’s hope Frye can help on that department. And also lets cross our fingers that the Nets buy JJ contract and he decides to join the Cavs.