
Time Sensitive Material: Open Immediately
2015-11-23I’m planning to do a larger piece that requires a lot of stats. It’s going to feature Delly, but the purpose is to examine how we consume basketball and how basketball culture colors our vision. I included a survey at the end of the Bucks recap and the answers were phenomenal. I love the readers here – you guys are the best.
Anyway, since I am lazy and haven’t used my computer programming skills to create database scrapers that give me the data I want when I want, I still spend an inordinate amount of time copying and pasting data from NBA.com or Bball-ref.
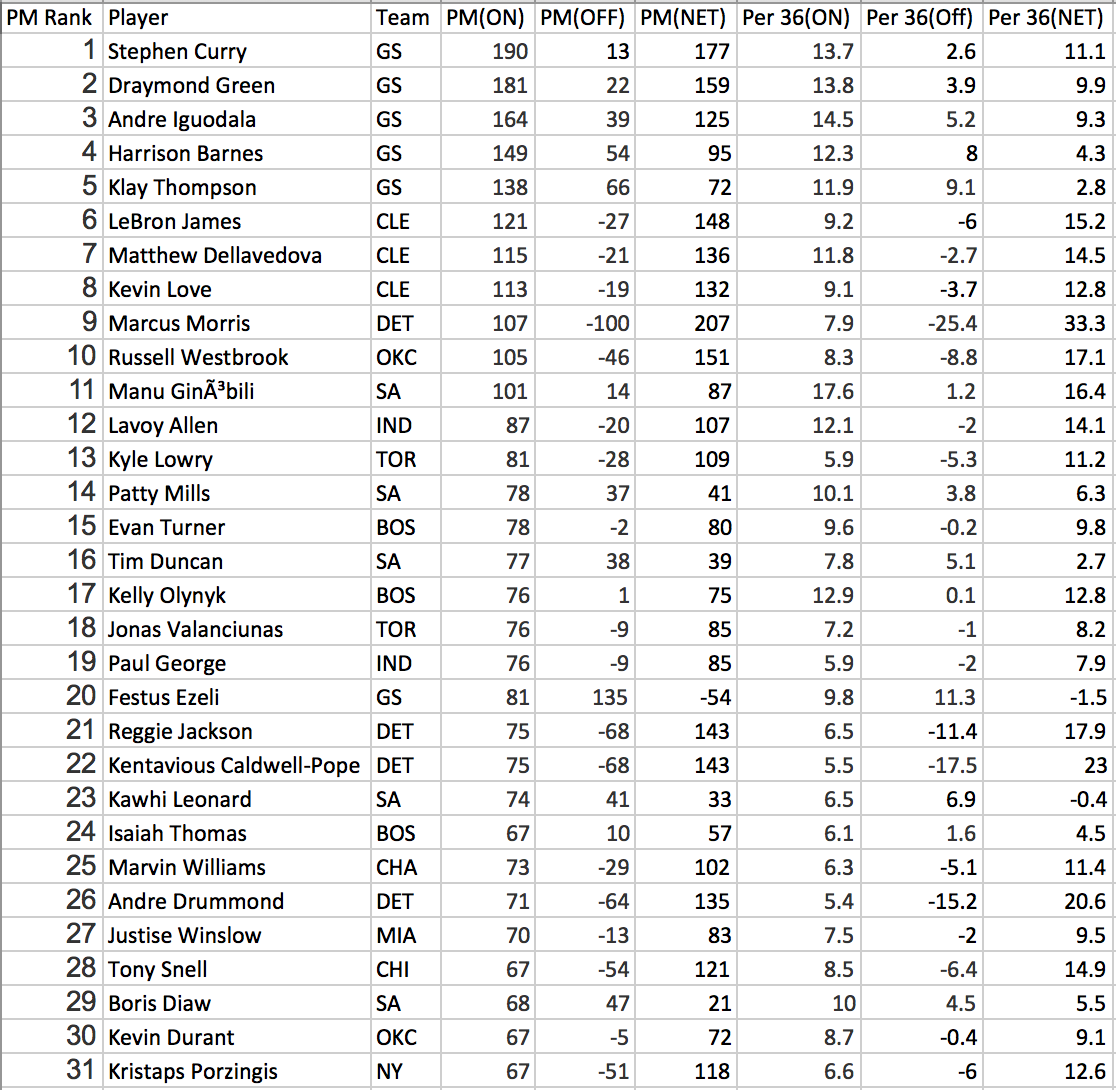
I wanted a list of raw plus-minus to date for the 2015-2016 Season. I found it here.
I used that list and then went to NBA.com’s Team/Player Matchup Dashboard for every. single. player up to Porzingis (#31 in raw PM). Why? Because I wanted to know more than just raw plus-minus. Specifically, I wanted to see the NET plus-minus. This can be a bit more instructive as to how necessary or valuable a player is (also, how bad his backup is). Let’s take two players and make some generalizations. Right now, Festus Ezeli is 20th in the NBA with a PM of 81. When Festus is on the bench, the Warriors PM is 135. If “Festus on the Bench” could be quantified as a player, he would be the 6th best player in the NBA by raw plus minus. So it’s safe to say that if Festus missed a few weeks with a sprained ankle or something, the Warriors would continue their assault on the rest of the NBA. Contrast that with Detroit PF Marcus Morris, (traditionally perceived as the lesser of the Morris Twins) who boasts a PM of 107, higher but certainly comparable to Ezeli. For some reason or another, when the Pistons have trotted out lineups sans Marcus Morris, they’ve given up 100 more points than they’ve scored. In just 142 minutes! That is…wow.
Now, it’s early in the season and raw plus-minus has the potential to be very biased, and at this juncture, random. This data could suffer from collinearity, sample size, uneven schedule, garbage time…basically anything and everything could skew the results in some way. This is a great primer on PM and methods to improve it.
But it also reflects some truth. These players’ teams have done exceptionally well when they are one of the five players in the lineup. That matters. In fact, it matters more than anything else if you really stop and think about it. Once your roster is assembled and the long grind of the season commences, the goal of every team is to outscore the other five guys on the floor until the outcome as been decided. But we don’t really absorb basketball that way. Other than Papa John, does anyone decide whether or not they like a pizza by going into the kitchen and trying all the raw ingredients ala carte without ever eating a few slices after it’s finished baking? The reality is that basketball is a free flowing game, so if we view players like ingredients with just a few characteristics (Points, Rebounds, Assists, Steals, and Blocks, etc) we can develop a blind spot for so many of the nuances of the game, particularly the chemistry between players, and Defense, which box score stats reflect poorly.
We have a tendency to assume that players with prolific stat lines or efficient shooting percentages are the guaranteers of winning basketball. And on the flip side, we assume that players with a broken jumper, or those much maligned power forwards that are “struggling to fit in” must be hurting the bottom line. And that’s not always true.
So I’m posting these stats as a palette cleanser. By the time I write the main piece these will have changed. But it’s useful as a backdrop of sorts.
Data in Google Doc Spreadsheet

Great stuff Tom! Looking forward to the further analysis as well!
Delly has a place in the NBA and a place on the Cavs. I like him enough that I hope he doesn’t leave and continues to get meaningful playing time.
If he leaves, it’ll be because the Cavs let him. He’s a restricted FA next year, so they can match any offer. The difference between TT this year and Delly next year is the abundance of money teams will have next year, that they did not this year.
Hi. 2 year lurker (following Delly), first time commenting. Something I take from the published list is that in the top 20 are two Australian point guards, trained as teenagers at the Australian Institute of Sport and later playing college ball at St Mary’s California. It is highly competitive to be even selected to attend the AIS. You live, board and go to school there, leaving your family whilst still in high school. If you don’t live up to the high standards, your scholarship is rescinded. At the AIS the kids are taught not just the basics & how to… Read more »
I’ll take LeBron, Love, Irving, TT, Smith, Moz, Shump, RJ, Mo
Then if your 10th guy is Delly, sure.
You obviously didn’t attend the Australian Institute of Sport.
To have nine other players ranked ahead of Delly is more indicative of what a stacked roster we have, cuz that’s a heck of a player to have as your 10h man.
Except that RJ has absolutely not been playing better than Delly, not even close. RJ is Shawn Marion minus the not being too decrepit to play part.
7.5 ppg shooting .456 and .385 from three in 24 minutes per game. Jefferson has been pretty darn good.
Delly is shooting .425 and .333 from three with 7.3 ppg in 27 minutes per game. Pretty comparable.
As long as you completely ignore the fact that defense exists, assists, and running the offense, I agree completely.
RJ has been great. So has Mo. So has Smith. However, I don’t think I’d put any of them ahead of Delly as far as importance to their title run.
I’m just impressed Cols didn’t put JFJ ahead of Delly.
RJ and Smith are definitely more important to the team. If Delly goes down all it means is more minutes for Irving/MO/Shump and Smith
We don’t have another decent SF other than RJ.
Don’t think I didn’t consider it.
Cols with the hot takes!
Hey FatDazza — Welcome! St. Mary’s clocked Stanford yesterday with a half-Australian roster, so there may be more Aussie Gaels on the way to the NBA.
Had to put this somewhere : Cleveland Cavaliers forward LeBron James was asked for his thoughts on Golden State’s winning streak and the four-time league MVP had some interesting things to say, according to Dave McMenamin of ESPN.com. “I think it comes with a lot of health,” James said when asked about the Warriors tying the all-time mark for best start to a season at 15-0. “They’ve been healthy. They’ve been the most healthy team I’ve ever seen in NBA history, and they have great talent. Those guys all play for one common goal and that’s to win and that’s… Read more »
Me too! I was wondering about that, and I think its more likely to get into their heads than to fuel them. Coming from a young guy? Yeah, disrespect might fuel them a bit. But from a Future First Ballot Hall of Famer? I think it will get in their heads a bit.
Does it wobble and fall, or keep spinning?
Based on how he changed his brother’s screenplay for Interstellar, I say Christopher Nolan doesn’t want kids to be orphaned in Inception. It falls.
STAY WOKE
I’ll tell you what jumps out at me looking at those stats: Detroit’s starting lineup has meshed incredibly well under Van Gundy. The four on that chart are all above 17.9/36 minutes. That’s incredible. That’s better than Golden State.
It’s not so much how good their starters are, but mostly how bad their bench is. Golden State’s bench is better, therefore the GS starter’s off court numbers are still in positive while Detroit’s are DEEP negative.
Compare GS starters to Detroit starters on court numbers though and the Warriors double the Pistons.
That’s true, but it tells me that Detroit isn’t that far off. They look like they’ll make the playoffs this year, when depth isn’t as important (unless injuries). If they add some good depth in the offseason and maybe attract one big talent…they might have something.
Years ago when the Kobe v LeBron arguments had reached their apex, someone tried to describe how most fans didn’t hold Kobe’s shooting efficiency against him because they didn’t penalize missing difficult shots. (By this measure, J.R. Smith is the greatest shooter ever). Basically, hero ball was OK stats be damned because it looked cool. Might be seeing the corollary with Delly. That’s what I’m hoping my piece explores. I got a few answers in the survey that indicated some of you are hypothesizing the same thing wrt the perception of Delly.
Nope. This isn’t it. Delly is averaging 6 points and 5 assists in 25 minutes a game. That tells you all you need to know. Decent enough role player who knows his role and doesn’t shoot very much (because he generally can’t shoot except wide wide open threes) who doesn’t make stupid passes and is a pesky defender.
He’s a great guy to have on the team. Especially now that he put down the coffee and donuts and looks to be in much better shape.
10 assists per 48 is someone who does more than just avoid stupid passes.
Tom –
Both the article you linked to about APM and your comment above reveal that you understand precisely why raw PM is not a very informative statistic. But then your analysis (and your Delly arguments) rely only on raw PM numbers (and sometimes Net PM, which also has major issues).
This all leaves me confused. So I ask: why should we put a lot weight in the spreadsheet you linked to, which has raw (and net) PM for a sample of 15 games?
Hot Sauce – good question. Because raw PM is easy to digest and tells us something at least. APM and RAPM use raw pm as their inputs so it’s just a refinement of the same data. You don’t have to put “a lot of weight” into the data – it’s just an interesting “hey there’s some smoke…let’s investigate and see if there’s a fire” kinda palette cleanser. I have 2-season vanilla RAPM data for Delly that will factor into the next piece, as well as a whole slew of other data. The piece I wrote on Cavalier Combos from Delly’s… Read more »
The Piston’s numbers net numbers are mostly a product of their terrible bench. The starters on the court numbers are pretty good, but not great by any means, but their off court numbers, when the bench is playing, are downright pathetic.
Good intro piece Tom. Stats don’t lie so I’m curious to see how you are going to defend your boy Delly!
Delly is most definitely my boy. But fanboyism is a crutch not a pillar when vying for the hearts and minds of the basketball subculture (or anything else). I’m interested in the larger question: why do my eyes tell me Delly is a very valuable basketball player while others consider him lucky to be in the league and a garbage time player not worthy of 10 minutes a night? In this case both sides point to stats to back up the arguments. Of course this kind of thing happens all the time, but the degree to which Delly polarizes even… Read more »
This is great stuff Tom. Raoul, I think that the perception and reality of Jared Cunningham are a bit different, likely because he has shown something where nothing was expected. He’s shown some ability on defense, and he is explosive, but he’s a poor finisher around the rim, and his shooting percentages are all below average. As a 13th man in case of an emergency he’s fine, but I can’t see him playing at all when everyone is healthy. To be honest, he reminds me a bit of Dion with less of a handle but better defense.
Dion??? I respectfully disagree on so many levels.
But why? I think Cunningham’s a better defender, but where has he proven to be more efficient or effective on offense? Remember that Cunningham has played on five teams in four seasons and didn’t finish last season in the league. 127 minutes this season is not really enough to prove anything, and his numbers per 36 are still below average by league standards.
Until he starts jacking up off-balance deep twos with abandon… the comparison doesn’t apply… ;)
This is very interesting work especially to see if these are indicators of how the Cavs are doing compared to the rest of the league. Can you imagine what they will be once Kyrie gets back?
I checked Delly’s BBref page for sponsors, and the sponsor is Cols714. FYI.
Something that maybe in your link about improving plus/minus that I didn’t read that would obviously help improve it knowing how much time the player plays with other plus minus extradinaire players. By this I mean a large part of Marcus Morris’s insane net plus minus is probably that he plays nearly exclusively with Jackson and Drummond. This cannot be said of Delly though which is why his net and total plus minus are so impressive. He has played most of of his minutes I think with at least one of Love or Lebron on the bench. On a second… Read more »
Hey Rodney – yeah, Raw Plus Minus will never account for that, which is why it’s limited. If you always took the floor with LeBron you’d obviously have a good raw Plus Minus even if you did little to deserve it. Adjusted Plus Minus is a regression that takes every other players’ Plus Minus into account when assigned it for one player. So it adjusts the amount of credit that each player should get based on the other personnel on the floor. Check out the section “Adjusted Plus/Minus: Collinearity & Sample Size” in that link I posted. RAPM takes this… Read more »
In that scenario of Jared or Delly playing with or without Lebron why not consider referring to the 5,4,3,2 player line-ups as well?. Those stats can show consistent patterns and even the playing time with various players and various playing times. http://www.basketball-reference.com/players/d/dellama01/lineups/2016/ And since Delly’s name is often mentioned, yes you can see his +/- is 72 with the starters at 31 mins vs the traditional bench of Jared, RJ, JJ ,TT whereas he is+26 at 17 mins playing time. Incidently, he doesn’t have any negative +/- with any player line-up in those various 5 man rotations. Why not go… Read more »
Good points RM. I agree that it is fun to debate informed fans (also with Cols). Right now I will debate with you on your recent discussion on why MDN will not play in the playoffs. (1) It might be true that he is the 7th best guard, but not on D. Given that KI is weak on D, and Mo is worse, and the finals are likely to be CC Vs. GSW (with astounding shooting guards), you can be sure MD, IS, and MDN will all be chasing SC and KT around the Gym. (2) What is it you… Read more »
Plus there’s the possibility that some of the other guards will be injured, which unfortunately has been known to happen from time to time.
Rauol, Cunningham plays great defense in my opinion. If we wanted to use him for 4 minutes to harass Curry full court that would be fine. The problem is even though he has great feet and tremendous ups he’s pretty small. Curry can shoot over anyone but giving him the height advantage is going to make it worse. And While I do think our best chance will be to throw bodies at Curry non stop and try and tire him Irving is still going to play 35 minutes. And I’d rather have Delly play the remaining 11 minutes and just… Read more »