
The Not So Great Offensive Rebounder….Part I
2015-10-15
“I’m busted.”
If I were to ask Cavs: The Blog readers to tell me what Tristan Thompson’s number one skill is, I would likely get three different answers. Tristan is great at staying healthy, switching on pick and rolls, and getting offensive rebounds. I won’t argue that he hasn’t been healthy. For his entire career, TT has missed just six games. I would also agree that Tristan is effective switching onto little guys in pick and roll situations, although I have no stats to back that up.
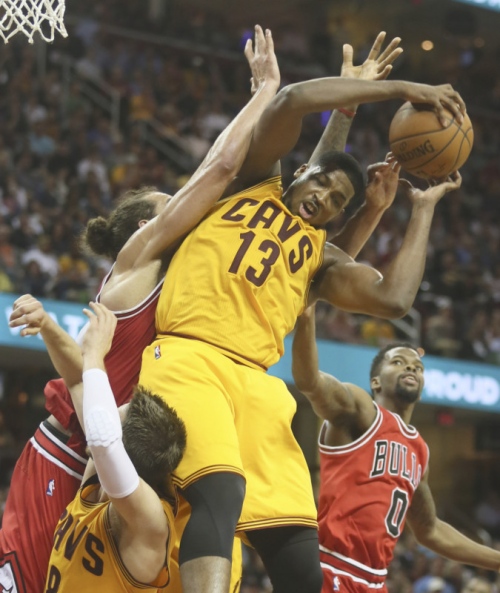
I do, however, take issue with saying Tristan Thompson is a great offensive rebounder. In the most simple terms, an offensive rebound is just catching a missed basket on the offensive end of the floor and Tristan does that quite well. Last year he grabbed 3.3 offensive rebounds per game in the regular season, good for fifth best in the NBA.
An offensive rebound matters to a team because it results in an extra possession and every possession is a chance to score points. If the offensive board were a meal, the act of getting the board is loading food on a utensil. Ultimately, though, it’s getting the food into your mouth (or, in this case, scoring points) that really matters.
Let’s look at the league as a whole to gain some perspective on offensive boards. During the 2014-2015 regular season, 246,035 total points were scored, 26,781 offensive rebounds were sucked up, and 32,533 second chance points were dropped. On average, 13% of a teams’ points were second chance points and an offensive board was worth about 1.21 points.
The Cavs scored 8,457 points during the season, and 1,047 of them were second chance ones, about 8% overall. The Wine & Gold were ranked 18th for second chance points total. The Thunder ranked number one in this category and second heaves accounted for nearly 15% of their baskets.
From a per o-board perspective, the Cavs earned 1.14 points for each one.
Statistically speaking, the Cavs were below average at both grabbing offensive boards and getting points from them. Even though the -.07 point differential doesn’t seem like a lot, it’s significant considering that all teams are separated by about just .25 of a point in this category. Seeing as Tristan Thompson accounted for 42% of the Cavs second chance boards, his difficulty converting easy put-backs deserves some of the blame for the Cavs second-chance struggles.
Let’s look at Tristan Thompson specifically now. It’s a bold accusation to say he isn’t a great “offensive board” (in the complete sense of the word) getter; Rich Paul is requesting a $94 million dollar contract for this skill after all. The best way and the only way available to me to analyze this strength of Tristan is to look at his putback stats (a putback occurs whenever a player gets an offensive board and goes up with it again). I would love to look at exactly what happened after each and every Canadian offensive rebound to find out exactly what they’re worth points wise, but I have a girlfriend, a job, dogs, and a life.
To narrow down the number of players that looking at putback stats spat at me, I put a filter in to eliminate any guys who played less than 45 games and had less than 100 putback possessions. 33 players come up under this criteria, and the results don’t paint Tristan in a flattering way. On putbacks he got just .82 points on each of his possessions, which tied him for 33rd with Tyler Zeller. He was 32nd in shooting percentage making just 40% of his attempts. Big T turned the ball over 7.8% of the times he went up with it, earning the 30th spot on a 33 man list. And, all of that data looked at together placed Tristan in the 11th percentile for putbacks last season.
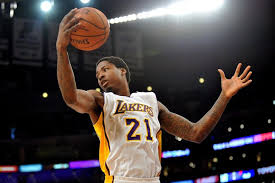
Ed Davis was on this list with Tristan too and is an interesting player to compare him to, considering he had an identical per 36 offensive rebounding number of 4.5 last year. Davis was in the 71.1 percentile bracket on this list. He hit his putbacks 62.2% (6th) of the time, turned the ball over at a 3.3% (8th) rate, and got 1.18 points per putback (9th). What’s even scarier about comparing these two guys is that they each take about 25% of their shots after a rebound. Davis and TT are almost the same player, and TT is failing at offensive rebounding when you look at his numbers next to Davis’s.
Now, some readers might say that all the above paragraph proves is that TT just couldn’t finish his second chance attempts. They could say that TT is kicking the ball out to the King and playing garbage shot clean up man, but that’s not entirely true. Tristan only passed out of his offensive rebounds 39% of the time (107 total passes) he grabbed an o-board last year. He’s hunting for points, but just can’t get them to drop and neither can his teammates on those second chances, as shown by the Cavs’ below average points per board stats mentioned above.
It isn’t that big of a stretch to infer that being able to finish second attempts is what makes a team above average at being a complete offensive rebounding machine. Remember, a meal is no good if you can’t get any of the food to land in your mouth.
Hear me out for just a few more paragraphs. Organizing players’ putback stats by field goal percentage places LaMarcus Aldridge at the top of the list. Hassan Whiteside and Tyson Chandler then followed. The Blazers earned 1.25 points per board in the 2014-2015 season, while the Heat and Mavericks got 1.32 and 1.25 points per o-board, respectively And, just to bring up TT’s double again, Ed Davis’s Los Angeles Lakers put up 1.23 points per offensive board, while ranking 12th overall for offensive boards. Efficiency matters for a team to actually gain anything from offensive rebounding players. The Heat had just 747 offensive rebounds, which was 29th in the league, but they were more efficient at utilizing them then most of the league.

The Cavs need to really examine what Tristan’s offensive rebounding ability brings to the team because there is a chance it’s not as much as it seems to be. TT is asking for $94 million over five years right now. Of the players on the putback list that was generated for me, only Brook Lopez, LaMarcus Aldridge, DeAndre Jordan, and Anthony Davis are slated to make more per year than what TT desires. The above list features guys like Jonas Valanciunas, Ed Davis, Serge Ibaka, Gorgui Dieng, Robin Lopez, and DeMarcus Cousins. Those players all are better than TT, in some way, at a skill Rich Paul is arguing Thompson may be one of the best at. They’re also better at skills such as blocking shots and getting their own shots.
Where ever you stand on TT’s contract situation, this is information you should consider. As cool as Canadian TNT looks jumping into a herd of giants to get back a leather ball that he shouldn’t be getting back, it might not affect the game as much as you think.
In part II, I will look at Tristan’s clutch offensive rebounding data and how he performed in the playoffs.
I pulled putback data, offensive rebounding data, and points data from NBA.com. The information about second chance points came from FoxSports.com. All stats in this piece are from the 2014-2015 regular season.

Hot off the press… check it out. I think David’s work is validated by this analysis.
http://fivethirtyeight.com/datalab/tristan-thompson-isnt-worth-anywhere-near-94-million/
Finally got to this. Great article guy. We’ll know in a week if the murmurs that the Cavs pulled the offer off the table, but I wouldn’t blame them if they did. The Cavs will have more than enough depth to win the East without Thompson. An interesting sidebar to the Thompson holdout, is that LeBron could be AWOL as leverage for TT. Perhaps his back really does hurt. Maybe he really was sick a few days ago. LeBron can be a drama queen sometimes, and he loves played Head Games more times than Foreigner.
How I feel about the TT contract negotiations right now: https://vine.co/v/eEdvmvFOj5A
Let’s not forget TT’s most egregious offense: planting one on the angelic Allie Clifton.
BTW David, fantastic article… very well researched and I’m looking forward to the next article.
I would have to say that I’m not that surprised by the findings considering the performance of the team pre-trade. I think TT moving to the bench greatly increased his effectiveness.
I think the best TT can do at this point is 3/39 with a 3rd year player option. 3/39 is over his market value, and 3rd player options lets him get into free agency at the beginning of his prime.
I think it was telling that LBj said his message about the deal was not only directed at the Cavs’ FO.
I think that’s a perfectly reasonable deal for both sides and I think it’s a pretty good place to end up.
I think your work was the inspiration for the claim iirc… kudos to you!
This is being reported as news, but seems like speculation…
Well, that was a dumb move by TT. He should’ve just accepted that offer.
I approve this message.
Did COLS just say something moderately agreeable that actually makes sense!?
Hmm…hadn’t thought of that.
This is why you always make sure your client is willing to accept the consequences if things go bad. I always tell that to my clients – if I’m playing hardball, I let them know the downside if our bluff is called. I doubt Klutch did that because they thought they’d win. Did they really tell TT “Be ready to sit out the entire season” or “if they pull the offer, we have to just accept peanuts if our bluff isn’t called.”? I doubt it.
Great article. I look forward to the second part about Tristan’s value in offensive rebounding at crunch-time. To me, this is far more important than put-back points. In the final minutes, offensive boards steal valuable possessions and time away from the opposing team. And the mere threat of that happening with Thompson on the floor forces the opposing team to have one or two players dedicated to boxing him out (and hence occupied on defense). But I look forward to seeing how you guys try to quantify his impact in that arena.
I agree. I believe that TT excelled in the playoffs with his offensive rebounding and it seemed even more so late in games. I’d be surprised if Part II doesn’t support that view. That performance helped make his reputation.
While I think he’s asking for way too much $$ and shouldn’t be paid that, if he excels in crunch time o-boards, especially in the playoffs, he can be a big help.
How are tap-outs scored? Do they count as a offensive board if the player never possesses the ball? I think TT gets quite a few of these, where he doesn’t ever control the ball himself, but the Cavs get a second possession.
Come on TT — GET IT DONE! Missing this season is just so dumb. This is the world championship we’re talking about — don’t blow it!
This is a great question regarding tap-outs. I’d love to hear an answer. Also, what about drawing a foul on an opposing big while going for a rebound? Doesn’t show up on the stat sheet but it happens often to TT. In the playoffs it seemed like TT’s ability forced other teams to specifically game plan to stop his ORebounding. I’d think it’d have ramifications on lots of things we haven’t thought of…. number of transition sets successfully pulled off by an opponent, number of offensive board opportunities given to our other guys due to TT being the focus, Def… Read more »
I can’t imagine TT is enjoying his representation right now. He’s got to be incredibly frustrated, stuck between wanting to play and feeling obligated to listen to the guy who supposedly knows what he’s doing. Griff shouldn’t budge. Taking Cols point that we can’t replace him because we are over the cap, in part, that is true. We can’t sign someone else right now, but there are three options: 1. Let TT hold out unless and until Kevin Love gets injured just prior to or during the playoffs. Sub Klove for TT and the Cavs beat the warriors, Period. 2.… Read more »
Yeah. If he holds out, his value diminishes. It was at it’s peak in the beginning of the summer when the Cavs upped their offer to 80. Word on the street is that the Cavs have pulled the 80 offer. TT, having let the QO offer expire, has 0 leverage now. He could sit out and make $0, and maybe make this the end of his NBA career (seriously, he’s not that good!), or he can take whatever the Cavs offer, at this point – or whatever the Suns or 6ers are willing to offer. Either way, he has 0… Read more »
1. Here is another reason not to give in to TT: It sets the example that the Cavs cave in to any demand. Then everyone on the team will refuse to play until they also get a max contract. 2. Mike P: Cols yammering on is kind of a tradition here. It is actually kind of fun. Often someone (usually Nate or Evil) goes a couple of rounds trying to talk some sense into him (I am guessing Cols is a guy). So far, no luck. Also, every once in a while Cols says something right on the money, which… Read more »
I agree that Cols is fun when taken the right way. Glad that he is a contributor. Good to have diverse opinions..makes for a lively and interesting blog that even he would agree, doesn’t suck.
VERY GOOD PT U-DOG—-ALSO I MENTIONED AWHILE BACK AND ESPN WAS TALKING ABOUT YESTERDAY MORE OFTEN THAN NOT PLAYERS ( ESPECIALLY PLAYERS NOT DESERVING/ AKA T.T. ) THAT SIGN A MEGA CONTRACT PUT TOO MUCH PRESSURE ON THEMSELVES ( ALONG WITH THE FANS ) THAT THEY ACTUALLY BECOME A LESS PRODUCTIVE PLAYER / GET FRUSTRATED / BECOME A LOCKER ROOM MALCONTENT AND EVENTUALLY ARE TRADED / WAIVED OFF THE TEAM —–DON’T KNOW WHY T.T. / PAUL CAN’Y FIGURE THIS OUT —OH I GOT IT –IT IS CALLED GREED !!!
There should be a “three comment maximum” for Cols714 on any thread. Can the mods make that happen? This is a terrific blog with superb writers/researchers, and very informed commentators. Cols717 constantly diminishes this high quality with his repetitive and somewhat simplistic comments.
Really? From time to time, I get a little tired of Cols714’s shtick, both here and at FTS. However, he typically knows what he’s talking about, and it’s not like he aggressively shames/rebukes people. He just disagrees with everyone typically, and has no fear in stating it. Also, for the record, I disagree with him here. TT at 5/70-80 will maybe allow Dan Gilbert to spend a little more in luxury tax via the Haywood exception/Mozzie re-signing if he feels it is the last move to take us to the title. TT at 5/94 probably causes more hesitation out of… Read more »
Thanks, I aprreciate it. Yeah, I repeat things too much though. I’ll try not too. But when ther are goig to be nmultiple parts written about why TT sucks (as it seems here), then it needs some push back.
Nobody is saying he “sucks.” Only that he’s not worth what he’s asking. If he sucks at anything… it’s picking someone to negotiate for him…
Supposedly, according to some random website, the Cavs have dropped the 5/80 offer. It makes sense because they have all the leverage now. It could also just be a negotiation tactic to get TT to end his holdout. It also makes sense as a strategic move to deter hardball negotiations from other agents in the future. Either way, I’m now super curious how this will end.
No way. Comment sections with Cols are a lot more fun, honestly.
This is how I see it. All opinions and styles are welcome as long as they are generally good natured, which Cols certainly is. He makes the blog more fun for me.
Hell yeah! Keep cols free!
(Even though I disagree about TT)
I would say TT excels at offensive rebound similar to a Rodman where he positioned himself, used tricks with his arms/legs(more like grabs/pushes), and expertly times his jumps all in the effort to grab a board. Unfortunately that can put you out of position for a putback. Not everyone is Shaq who in his prime could go straight up, come down with the ball, and explode through hapless defenders on his way back up to dunk. If Tristan passes out 50% of the time while grabbing a ton of boards its still better than most at providing second chance opportunities.… Read more »
I do agree with much of the sentiment here… I think the volume of offensive boards grabbed by an individual is more important than what he does with them. TT can be coached to pass the ball in those situations more often because he’s a slow gatherer and poor finisher. I feel like he got a grasp on this in the playoffs, because I remember a lot of tipouts to LeBron & Co. instead of awkward putback attempts. But my memory could be biased — the 2nd part of this article should shed some more light on the playoff run.
This is probably correct. I think also that one important factor is that teams have to account for him on the offensive boards which changes how they are able to get out in transition.
I’ve been looking for a place to focus my anger for this TT contract situation, and I found it: Rich Paul and Mark Termini. In the same way that naming a television program “The Decision” crossed a line from being good television to being something beyond the pale in the minds of Cleveland fans, I think that this could end up being a similar situation. We’re not there yet, and from a sports agent’s perspective, it makes sense. But we have two born-and-raised-in-Cleveland guys who are taking a position specifically because they know what is at stake. Team chemistry matters.… Read more »
The thing is – signing TT to a max contract does not GUARANTEE or even greatly increase the chances that the Cavs win a championship this year.
However, signing TT to a max contract nearly guarantees that the Cavs greatly diminish their chances of winning a championship down the road. I do not want to have to go through with this with Mozgov and have no money to give him. I don’t want to have to bring in Shawn Marions on minimum contracts every year to fill out the team.
Moz is going to be our breakout player this year. He’s going to be a load for opponents. And he’s going to be worth the max.
I look forward to us using the trade exception and TT never playing another meaningful NBA minute
Huh? Once again, it’s a contract negotiation not a morality play.
I expect they will both sign TT and use the trade exception.
Maybe in the perfect world, but I’ll say as a fan of the Cavs I’m no longer a TT Fan. Now maybe this all washes away and he re-signs and I’m cool with him just like I was cool with AV after he re-signed in 2007. I’m not contractually obligated to like the guy, and at some point even business decisions aren’t “rational”. I work in sales – I have plenty of customers that buy my product because they like “me”, not because I have the best product. I likewise have prospects that would never buy my stuff, because of… Read more »
I think your last point hit on a key issue here. Other players see what’s going on and can’t be pleased. One player’s greed is interfering with team…as even Lebron said, it has become a distraction.
The more this goes on, the more I dislike Rich Paul….he’s hurting the Cavs more than anyone…a point that hopefully is not lost on Lebron.
Yeah. I think this is actually one of the stronger arguments against Cols’ “It’s just DG’s money” line of argument. I really think that, though they probably won’t say it publicly, if TT is making the same money as Kyrie is, there’s going to be some weirdness around it. It will definitely affect team chemistry. Aside from all of that, Cols: what about trades? If TT’s contract is so bad it is essentially untradeable, then if a situation comes along where, say as LBJ ages and plays more PF, and there are fewer minutes at PF and TT isn’t playing… Read more »
THIS 1000x’s. This is why the Cavs should fight for every dollar. This is why they should be workin for 5/60. He coul actually be considered a good value in a few years. Then if we need to replace Irving because of injury maybe we can. Or if we move LBJ to PF.
You’re kind of hilarious cols. You hate on Varejao, who is basically what TT will be in 7 years (hopefully he develops an offensive game like AV). You were probably against us signing Varejao to his demands when he held out because Lebron! Championship window! Cavs were right then to hold firm and are right now.
NBA Cares Program Sends Chicago Bulls Players To Spend Time At Hospital Visiting Derrick Rose
http://www.theonion.com/article/nba-cares-program-sends-chicago-bulls-players-spen-51547
The onion wins at everything.
I think on Sunday, with KLove back, they will try to go with a starting lineup that more closely resembles what the first few weeks of the season will be.
Good for him. Screw you NBA preseason!!!!!!!!!!!!!!!!!!!!!!!!!!!!!!!!!!!!!!!!!!!!!!!!!!!!!
More Ninjafield!!!!!!!!!!!!!!!!!!
I don’t know if this has been mentioned but TT also plays with two of the best at getting to the hoop in Irving and LeBron. They draw so much attention, which allows TT to wonder and grab “O” boards. He’s not as good of a rebounder on the other end because it’s more evenly matched.
He also “Wanders” while he’s “wondering.”
I agree completely Arch. He was the last guy to cover and they just fouled him if needed. That it is why he didn’t stand out so much previous years.
Really interesting piece, DW. Puts the importance of offensive rebounding into perspective. TT and RP really should have just taken the 5/80 when it was reportedly offered at the beginning of free agency. If that offer is still available, they should take it. Here’s how the Cavs could incentivize TT and let RP save face by just signing for the 5/80… -Bonus incentives for each 5% increment over 60% he shoots from the FT line -Extra $10K every time he dunks a ball instead of bringing it below his waist and subsequently getting blocked -$5M bonus for winning 6th Man… Read more »
Yes, 5/80 should get it done, and probably will. But if they do pay 5/90, everything will still be exactly the same.
You HAVE to know this isn’t true, right? You can’t keep saying the same thing over and over and make it true. Have you read any of the comments above about WHY everything won’t be exactly the same?
The only difference between paying him 5/80 or 5/90 is that Gilbert has to pay more money to TT and is cap tax. There is no other difference.
I encourage you to scroll back up and re-read cwzagger’s post more carefully…
keep up the good fight.
We are above the tax no matter what we sign him for. 5/60, 5/80, 5/90 doesn’t matter. Unless he signs 5/10.
I encourage you to scroll back up and re-read cwzagger’s post more carefully…
I did. Once again, no matter what we pay him we are above the tax.
I encourage you to scroll back up and re-read cwzagger’s post more carefully… (this time pay attention to the tax apron restrictions)
We’re above the tax apron this year if we sign TT and probably next year as well depending on what we do with Mozgov. We’ll be close to the tax apron the following year as well. This likely has more to do with Dan Gilbert’s money than with having flexibility to sign players.
I don’t believe that’s true if they sign TT for the 5/80… especially with the cap expected to exceed $80M next season…
The cap is going to be adjusted. Way up. It’s not clear that we’re above the cap in future years. Right now it makes sense for the Cavs to try to defer as much salary as possible into the future.
EG is correct… I looked at the salaries on basketball reference, and in 2 years the Cavaliers potentially have nearly 30 million in cap space including LBJ’s max salary, excluding TT, Moz, and AV’s unguaranteed 10m. What they sign TT to, and Moz for that matter, unquestionably impacts the Cavs’ roster flexibility now and in the near future. It is the difference between a legit free agent 2017, and a veteran minimum… This is the point Cols and others don’t understand when they say “it doesn’t matter” what they sign TT at. It absolutely behooves the Cavs to ALWAYS manage… Read more »
@Dan is correct as well.
Of course flexibility is good, but the difference between 5/80 and say 5/90 is only 2 million per year. We will definitely be up against the tax apron next year even with the jump in the cap and most likely over it if we sign Mozgov. I took another quick look at the numbers. In 2017, the projected jump in the cap (and perhaps cutting Varejao’s salary) will create so much space that the difference in TT’s salary is going to have a much smaller impact in flexibility than on Dan Gilbert’s pocketbook.
You seem obsessed with Dan Gilbert’s pocketbook. Even without a deal for TT, he’s spending around $200M to put this team on the floor. He also offered a ridiculously generous 5/80 deal to TT, but that wasn’t enough. Seems like it’s a lot more about TT’s wallet than Dan G’s pocketbook, no?
C’mon man. I’m just pointing out that people are getting on Cols (and TT) for a bunk reason. They’re pointing out that it’s about flexibility and it really isn’t. Of course Dan G is investing a lot in the team. But from a fan’s perspective, who cares. 5/85 is reasonable for a win-now team, which is what we definitely should be. And it’s obvious that TT helps us win.
Disagree that it’s a bunk reason. Any edge you can possibly get for future flexibility, you have to strongly consider. It may only be a $2M difference in salary per year, but it grows exponentially in tax dollars.
@Pouch19… the problem with your argument is that you’re assuming the difference is 2m, which in my view is an incorrect assumption given the reality of the current negotiations.
I don’t see the Cavs paying anything over 80… and I think it will be a good deal under 80, thus making the difference far more substantial. I mentioned 3/39 with a player option, which would make the difference 6-7m, which would create the flexibility I mentioned.
Again, people keep throwing out that it doesn’t create flexibility… any dollar saved to get under the cap/tax apron/penalty creates flexibility.
Yeah, I’ve thought the incentives would help Klutch save face. During the Cavs live practice feed one of the Cavs beat writers said this as well and it made sense to me.
$5M in possible salary for an All-Star start.
$5M for sixth man of the year.
Call it a 5yr 90M dollar deal but with only $80M guaranteed.
Sounds perfect to me, I imagine it gets doen soone.
By most accounts, it probably doesn’t get done until January. The only potential leverage TT/RP have now is waiting to see if the Cavs either struggle or if another big gets injured. They are most likely hoping Cavs get off to a slow start with Shump out until mid-January and Kyrie rumored to not be ready until December at the earliest.
If the Cavs are rolling going into January, you’ll probably see TT sign for 5/80. If they are struggling or injured, Cavs may feel pressure to go to 5/85 or 5/90 (and this pressure will come from LeBron).
Oh, I think the Cavs will destroy teams with or without TT. I do think TT was pretty valuable in the playoffs though and that’s why I don’t mind overpaying him. It’s not like there are alternatives or that we gain salary cap flexibility either way.
You don’t mind… but the Cavs obviously do (and I have to believe LeBron doesn’t entirely disagree otherwise he’d be a lot more vocal about it).
Time and team performance are the only things that will dictate leverage from here on out… unless LeBron gets involved…
Like he has to hit 70% of his free throws?
Thanks David for all the research, this particular skill set appears hard to truly rate but you shined some much needed light on it. I feel like even the media is owning that TT and Paul over played this and Cavs are handling this right. The only way is capsule bite Cavs in the butt is if we have two or more big go down by the end of the season, that is when the talking heads will begin ” I told you so”. Not saying to pay him, I am all in on Griffin and the team that is… Read more »
Once again, there are no other options. It’s not, don’t sign TT and we can have flexibility next year to get someone else. It’s, don’t sign TT and we have nothing. This doesn’t cost anyone anywhere anything, except for Dan Gilbert who will still be a billionaire once they come to terms with a contract. I do not understand the growing consensus of this blog to not pay TT something like 5/80. 5/80 should and will eventually get it done. I don’t think we need to read anymore about how TT doesn’t “deserve” the contract he’s going to get. Maybe… Read more »
I don’t think many were against the offer of 5/80 originally it was high but so we were we. But when that offer didn’t work supposedly, many including myself became more skeptical about what TT was actually worth.
I actually appreciated the article with facts instead of just inflated opinion. Look forward to part 2
But the point is that it doesn’t matter what TT is supposedly worth on an open market. If the Cavs decide not to sign him, it’s not like they will gain any salary cap flexibility or be able to sign one of the supposed John Henson’s that are floating around. The alternative is nothing, that’s the problem and is why overpaying for TT makes some sense for the Cavs. I understand there is a line and 5/90 seems nuts, but what are we saving there in order to make our title hopes slightly dimmer? $2M a year? Not worth agonizing… Read more »
Not sure how many times the fact has been made that 2m more each year is not just 2m a year. Cavs were being generous and loyal with 5/80 he turned it down. Your logic of pay him whatever is just not good managing.
His skill set, which David points out contextually in this piece, is inherently replaceable. The greater part of his leverage was squandered when his bluff on taking the Q.O. was called. Cavs have plenty of rebounders on the roster to compensate. They can win a title without TT if he chooses to sit out the year. And they STILL control his rights if he does.
I bet you pay sticker price for your cars, Cols…
1. I’ve only bought 2 cars in my life 2. The auto salesman/woman doesn’t have any leverage over me and I can walk away whenever I want 3. Why does it matter to you if TT gets 5/60 5/70 5/80 or 5/90? 4. No matter what we pay TT we are well over the cap and have zero flexibility. 5. If Gilbert pays 5/60, do you think he will give CtBloggers discount tickets to the games? Make beer cost less at the games? or will EVERTYHING REMAIN EXACTLY THE SAME 6. If we pay 5/90 does this make the chances… Read more »
1. So, did people just give you cars, or do you steal them? 2. The only leverage they have is if you really want the car. If the Cavs must not really want TT at his price. 3. It doesn’t matter to me, but it’s stupid to overpay for things in life. 4. Not true… cap keeps rising every year and they do need to sign Moz (who’s skill set is less replaceable). They also still have the Haywood Exception which you conveniently always ignore… 5. I’m not advocating 5/60. I never have. TT and RP were stupid for not… Read more »
Learning to count with Cols!
EG’s #17 answer is on point. Actually, looks like all of them are.
I agree with you somewhat but I think you are missing the big picture. It’ll make a huge difference down the road, maybe three or four years from now, if they sign him to a 5 year $94M max contract. That extra money could hurt our flexibility or put us deeper into the luxury tax, which Gilbert might not be so willing to pay in the future. Look at all the teams in the past who overspent on free agents (the Knicks are a great example), it completely killed their roster when they tried to get other players and they… Read more »
why is he such an elite player? What does he do that makes him great? Arguably he has 0 great player skills let alone a multitude.
Copy, paste, Blaze pizza bite in Broomfield, yawn, back to sleep.
I would agree with your stance if not for the CBA rules stating that teams living above the tax apron: -cannot use the Bi-Annual exception and have a smaller Mid-Level exception -cannot receive a player in a sign-and-trade transaction (if they are still above the apron following the trade) -cannot match another team’s offer for the full Non-Taxpayer Mid-Level exception when competing to sign a restricted free agent === If the Cavs can win a title without TT (which I believe they can) then I see no reason the team should hamstring itself moving forward just to sign a replaceable… Read more »
“If the Cavs can win a title without TT (which I believe they can) then I see no reason the team should hamstring itself moving forward just to sign a replaceable player to an oversized contract.”
This a thousand times, yes!
But Ben’s comment above, and he is right, is that the amount we sign TT to DOES MAKE a difference. It’s not as clear cut as you portend.
If we sign TT for an insane amount it make the probability of us re-signing Mozgov next year less likely. This is important. TT’s deal is not in a vacuum.
Yes!
Mozzy >>>>>>>>>>>>>>>>>>>>>>>>>>>>>TT.
In age, yes. In playability in the playoffs, nope.
In replaceability, yep…
I would have to agree. Mozzy is more valuable than TT. ANe don’t want to take a chance on not being able to sign him. But Mozzy will probably be a team player and work it out.
I meant disagree of course
Love, Andy, JFJ, and LeBron can all play PF. Only Moz is a true center. TT can’t defend the big brusing Cs in the league. His size and skill set aren’t as valuable as Mozgov in a general sense. They lineups where Cavs go small and he plays the 5 are solid, though
It DOES matter for a) the luxury tax, which Gilbert might care a little about; and it DOES matter for committing the future (maybe unknown) cap levels… if we’re at the cap in the future, we won’t be able to seek additional free agents, etc.
In any case, TT has 0 leverage. None. Nada. Get another offer and the Cavs can match. Or he can make $0. For the Cavs, yeah – they can’t sign anyone else. But they have Love, Mozgov, Varejao, and Kaun. That’s not too shabby.
GREAT COMMENTS BY ALL —-COULDN’T AGREE WITH YOU MORE —-WE ARE MOVING ON ( TO A NBA CHAMPIONSHIP ) WITH OR WITHOUT T.T.
Use a trade exception, and get MARKIEFF MORRIS from the Suns…they can pick up Tristan if they will pay him enough.
Suns have to want to trade him, Lebron has to want him in place of TT, and the Suns can’t sign TT because they don’t have the room. But down the line such a trade may be an option.
Honest question David, I’m just curious.
Did this article fit your preconceived thought? In other words, did you suspect the results of the article beforehand?
So, I was thinking about offensive rebounding one day and looked up second chance points. I didn’t look at the header of the stars board first and saw that some team had just 80 to 90 for the season. I immediately thought that second chance points can’t be worth that much overall, thus offensive rebounding can’t be either. Turns out I was looking at preseason second chance stats, but that sparked me to go see exactly how much thy were worth. I had my hunch that TT was affecting stuff as much as people thought just because he couldn’t finish… Read more »
You know, TT’s biggest leverage may be that everyone involved with the Cavs seems to be so heavily invested in winning the championship this year. The Harden trade perhaps shed some needed light on how fragile title windows can be, and the Cavs don’t want any excuses to have missed theirs.
And this leverage pisses me off even more. Even in this inflated NBA economy, TT is worth about what we offered him last year. He’s holding the organization hostage because they want to win. “Pay me or your chances go down.”
Its for that reason that the Cavs kind of have to hold firm. Because if they give in to paying a role player the Max because they don’t have any other options, they screw themselves for the foreseeable future. Moz will have no reason not to hold out for the Max. Hell, Delly could hold out for max. Why not? If they can’t sign anyone else better, what choice would they have. If they give TT what he wants, it makes Shump and J.R. feel like they got a raw deal. Actually, there would be incentive for Shump to hold… Read more »
At this point, the Cavs have huge leverage. Thompson’s options are to get another offer, which the Cavs can match, or he can sit out. There is no QO option anymore. So he can make $0 by sitting out, or he can sign whatever the Cavs offer him. At this point, why shouldn’t the Cavs lower the offer to something actually reasonable – like a 4 year 48 million contract!
Great great piece, David. This is wonderful example of data matching some people’s eye tests and totally opposing another’s. There is nothing strange or wrong about some guys being much better individual players when they are playing with great teams. Guys like Battier and Diaw are examples of players whose skill-set requires other good teammates in order to maximize their personal potential. BUT, it depends on the skill-set! Diaw’s passing doesn’t help anyone if his teammates don’t know how to space and cut. Battier’s team defense doesn’t do much if the other four guys are out to lunch. Still, those… Read more »
I love this comment on almost all accounts.
Moz had actually played about the same number minutes as TT if I’m recalling correctly. Great comments Ben.
Great comment, Be,. To the point of paying a guy for his future value, you’re 100% right. So what is TT’s future value? Because if its the same as it was last year, he worth Ed Davis money. TT would’ve needed to show tangible improvement as a rim protector or scorer to justify a max deal and he’s done neither. No reason to pay him this much money. I’ve heard Jalen Rose spew his opinion all over ESPN that the Cavs can’t win without Tristan Thompson and they should pay him. He’s a backup on a good team pressed into… Read more »
I kind of think that the Cavs should just take their offer off the table and let him have the QO as the only option. Let the market set his value next year if some team wants to mortgage their future by making him a max offer. Just tell TT if you want to play this year, sign the QO. We’ll try again next year and if not, best of luck in Toronto.