
Trends, Ranks, and Outliers: Season 2, Episode 1
2013-11-20
Despite tepid reviews and complaints of seizures among children (due to image aliasing), TRO was picked up for a second season. The episodic series rated well, particularly in the 80+ female demographic1.
Highlights from Season 1 included:
- C.J. Miles’ disastrous start and remarkable turnaround.
- Incredible block differentials between opponents and the Cavaliers, marked by Tristan Thompson’s personal block(ed) party. (TT’s ‘gather’ had approached Rebecca Sealfon-territory)
- The curious case studies of Luke Walton: see Question 9.
- The short-lived but forever impressed-upon-our-hearts offensive grace of the Herculoids.
After a dynamic off-season, the Cavs began their 2013-2014 campaign with high expectations, despite a new coaching staff, an assortment of new players, and a roster that lost most of its veterans from the previous season. Early returns have disappointed many fans, as the Cavaliers sit second last in SRS2. While TRO’s mandate is to be wholly interesting and not necessarily comforting, it just so happens that there is some data to encourage the dwindling members of the “Don’t Panic!” subset of Cavs fans. Without further ado…
Established Trend.
Welcome back, Mike Brown! Someone (alright, it was Windhorst) recently said (and it may never stop ringing in my ears) that reputations are easy to gain, and difficult to change. It’s an oft unfair phenomenon and the foil of trust – which is hard to establish and so easy to forfeit with a single misstep. It’s the foot solider of a narrative – quickly deployed, always advancing a cause. A reputation’s mortal enemy is data-driven perspective, and it’s high time a little bit of that showed up in Mike Brown’s corner to defend him from the haymakers he’s receiving on the internet.
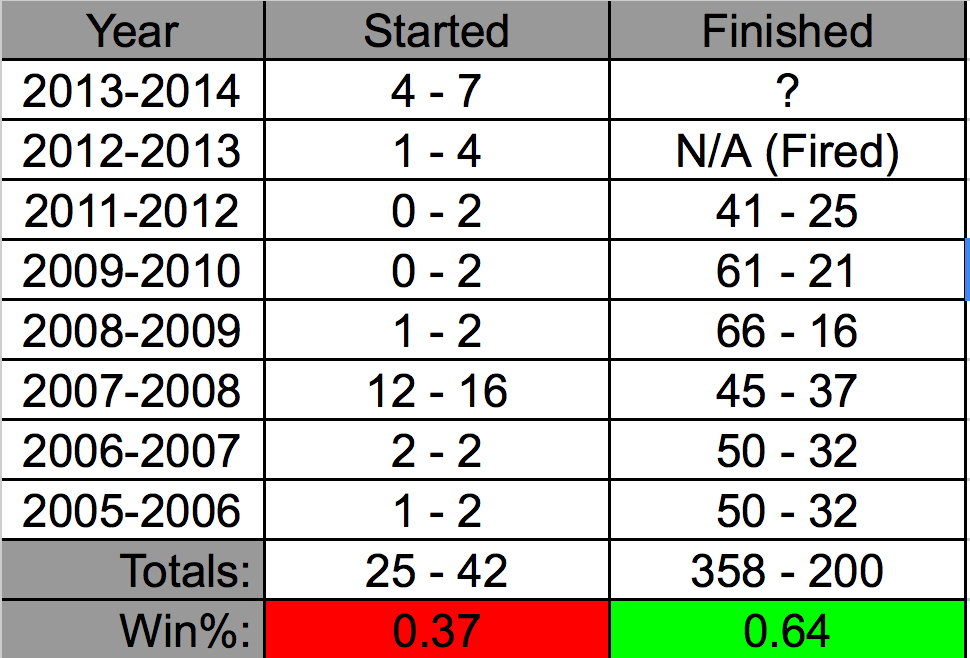
Mike Brown is no stranger to slow starts.
The spreadsheet above illustrates a long-term trend in Mike Brown’s resume: his teams always start slowly. During most campaigns only a handful of games was necessary to find a rhythm, but the fact remains. It’s easy to look at this season and brush off comparisons with an 0-2 start, but looking at the aggregate, it’s hard to argue that 25-42 (cherry-picked to make a point or not) is not wildly divergent from 358-200, which is Mike Brown’s current regular season total. Another fact to consider is that all those other teams that started slowly under Mike Brown were in a much more stable condition than the current Cavs. They featured more veterans, less roster turnover, and much more success in the immediately-prior season.
Consider also the Shaq experiment. In theory, integrating one of the greatest players of all time into a mostly-intact 66-win roster should not require much struggle – but it certainly did in 2009-2010. Not only did the Cavaliers drop their first 2 games and stand a measly 3-3 before exploding to 61 wins, but they averaged almost 10 points less per game during that six-game limp than they averaged for the season. Now consider the task of integrating Andrew Bynum onto a previously-terrible team composed mostly of players still fulfilling their first contract. Oh and he doesn’t even play every game, so there are different approaches to the offense between a Friday and a Saturday – it’s a lot to handle, and it’s fair to note.
This is not to say the problems are guaranteed to correct themselves, but the evidence is strong that Mike Brown-teams appear radically more competitive in April than they do in November, and this season has a multitude of challenges that would impede a fast start for any new hire.
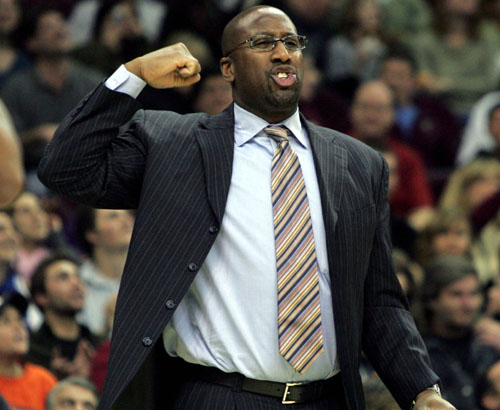
I can throw a haymaker too
Sustainable Trend?
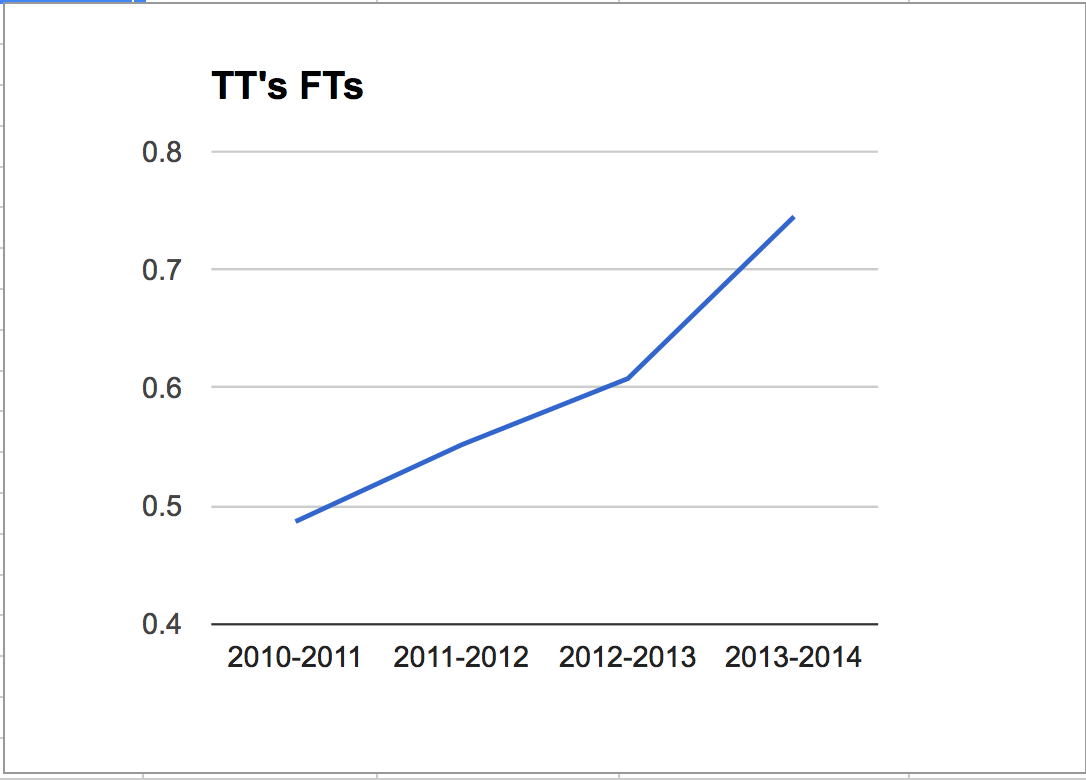
TT’s FT% by Year
Mark your calendars, and start price-ing out tickets for November 16, 2023, the day Tristan Thompson overtakes Mark Price and becomes the Cavaliers’ all-time FT% leader. Sometime during his 787th game3, Canadian Dynamite will bounce the first of a 1-and-1 (the NBA’s gonna get smart on this someday) just shy of the flopping-zone manifold and watch as his ball follows the optimal kinematic trajectory (Thanks, Sports Science!) through the holographic net, loudly tinted pink for Breast Cancer Awareness Decade. This mere point will propel TT to a career FT% of .90390, overtaking Price’s .90389. The game will be interrupted for 15 minutes to give all the spectators enough time to upload 3-D selfies of the occasion, and those chosen at random by Googazon (which now owns T-Bell) will receive enough bitcoins (or Schrute bucks, not sure which will win out) to redeem a Doritos-Tasties Quinoa Fold at participating T-Bells. (In this age, “Locos” and “Taco” are deemed hate speech and corn is less legal than Meth.) Purists like myself will try to belittle the occasion, pointing out that Mark Price made over 90% of his free throws with organic knees and a carb-centric diet. That’s old school right there.
I spent so much time re-learning the basics of regression (line-fitting4) that I had no time to research how rare TT’s feat is. Has anyone ever shot sub-50% from the line in college, and then started his career making 50+%, 60+% and 70+%? It’s absolutely phenomenal, and a testament to his work ethic.

Real Men make their Free Throws.
Ranks:
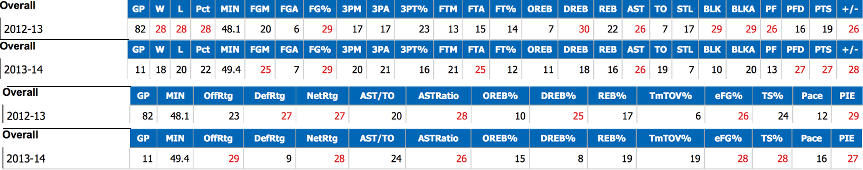
Right Click -> Open Link in New Tab to avoid seizures.
Here’s a chart I hacked together which gives a nice comparison between last season and the first 11 games of this season. If your browser is like mine it’s unreadable in this window (thanks WordPress for awful image scaling). The best bet is to right click on the image (it’s a .png file) and open it in its own tab/window. All of the numbers are between 1-30, basically, a league-wide rank, where 1 is best and 30 is worst.
Positive Changes in Rankings:
I’m ecstatic to report that the Cavaliers’ block differential won’t be appearing in the Outliers section of this episode. Last season the Cavs ranked second to last in shots blocked, as well as second to last in blocked shots. No longer! The Cavs are still getting a healthy number of their shots sent back but at least they are returning the favor. They currently rank 10th in shots blocked (top third of the league) and 20th (bottom 3rd) in number of shots blocked. The addition of Andrew Bynum is obviously helping the Cavs in this regard.
The Cavaliers finished 27th in Defensive Rating last season. And long before they had plummeted to such depths, Cavs owner Dan Gilbert declared via Twitter that the Cavs would re-introduce themselves to the NBA as a defensive-minded team. While the Cavaliers are not suddenly a defensive juggernaut by any means, they have demonstrated fundamental differences (did you know Kyrie fights through screens now?) in their approach to defense, and at times, their half-court defense has looked formidable. The numbers back this up, as the Cavaliers are currently ranked 9th in the NBA in Defensive Rating. It’s early, but a jump from 27th to 9th is significant enough to mean something different is manifesting, and the eye test confirms that as well.
After Anderson Varejao went down with injury, the 2012-2013 Cavaliers struggled to harness defensive rebounds. And it wasn’t just because the ball was usually going through the hoop when the Cavs were on defense. No, they ranked 25th in the league in Defensive Rebounding Percentage, which only looks at potential defensive rebounds. This season that ranking has improved to 8th, a huge jump, giving Mike Brown something to feel good about.
Negative Changes in Rankings:
While the Cavs had trouble generating assists last season, they took care of the basketball. They were near the top of the league all season in limiting turnovers, ranking 6th at season’s end in Turnover Percentage. This season that has ballooned to 19th, and without any meaningful increase in assist ratio. In other words, the Cavaliers aren’t turning the ball over because they are taking more chances, they are just playing extremely sloppy basketball. It seems as though the Cavaliers are out of sync on offense and are finding it almost impossible to make quality passes that lead to high percentage shots (more on that in the Outliers section). They are averaging about 2 more turnovers per 100 possessions than last season, which isn’t the end of the world, but something they need to clean up, especially since the turnovers aren’t a by-product of a high-risk/high-reward approach to offense.
The Cavs made improvements in almost all of the athletic defensive rankings: D-Rebounding, Steals, and Blocks. And they’ve done it while fouling less than last season. It’s strange then, that such a young, spry team is finding it so difficult to generate free throws. The Cavaliers are sporting a .243 FT to FGA rate, 25th in the NBA. Compare that with last season, where they posted a .265 FT to FGA rate, 15th in the NBA. Shouldn’t a team that added Andrew Bynum be getting to the line more, not less?
The Cavaliers are first in the NBA in percentage of their points-scored coming from mid-range, also known as the most inefficient zone. They are second to last in percentage of points-scored coming from the paint. Both of these rankings are worse than last season. The strange thing is, that the Cavalier players most likely to score from mid-range last season were all of the Herculoids. You may recall Mo Speights was actually pretty good at mid-range Js. The culprits this season are Jarrett Jack, Dion Waiters5, and Anderson Varejao. Maybe you’ve been paying attention to the healthy dose of Varejao pick and pops that has become a staple of the offense.
No Change in the Rankings:
The Cavs finished last season ranked 29th in FG%. They currently stand at 29th, despite unsustainably hot shooting from C.J. Miles and Alonzo Gee.

It’s quite obvious Dion isn’t attacking the rim enough. From this we can conclude that Mr. Waiters does not in fact, read C:TB. Pity.
Outliers:
Anthony Bennett’s historically rough start definitely gets the award for early-season outlier. Fortunately for TRO, C:TB’s Nate Smith already dug into the archives to demonstrate this.
Here’s a quirky one, and one that would normally not draw my attention. The Cavaliers have failed to cover the spread 9 times already this season. The next closest team has only failed 7 times.
The Cavaliers are last in the NBA in points in the point (PITP). The graph below shows PITP and Opponent PITP. (Once again, open in a new tab/window to view clearly) The Cavaliers are giving up a lot of PITP too, but at least they are not an outlier.
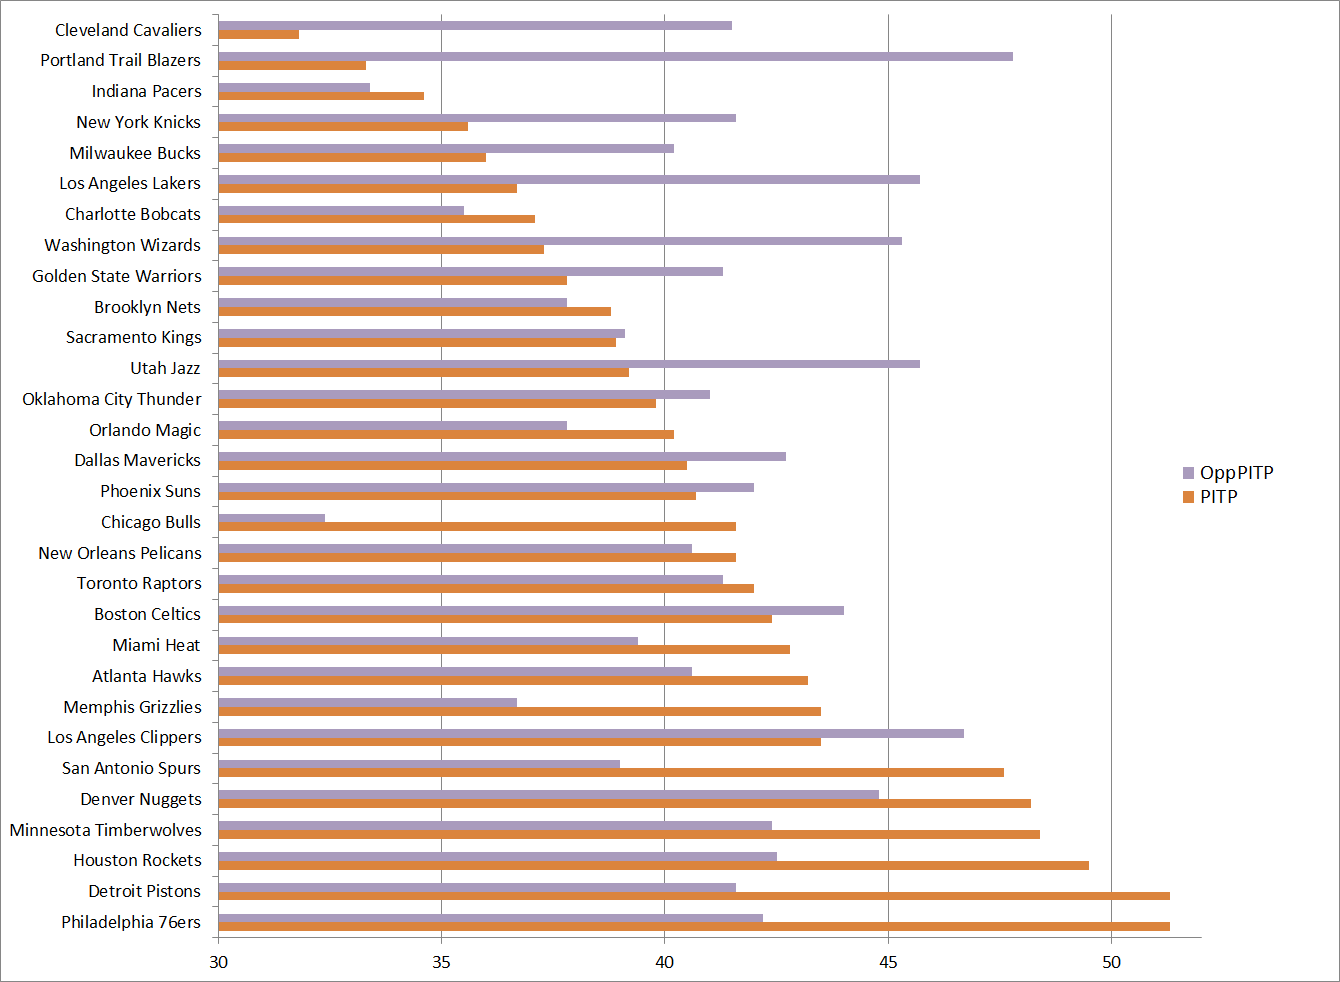
Get in the paint, draw some contact, get some easy buckets, get to the free throw line.
The goal for the Cavaliers should be to start generating easy shots. We’ve known for years that offensively, they have individual talent. Byron Scott never seemed to get them to become more than the sum of their parts. Now the tall order is on Mike Brown. Many things need to change for this team, but as long as the offense consists of mid-range jumpers, unassisted 3-pointers, and an aversion to the painted area and free throw line, the Cavaliers are only going to win when they get unsustainably hot taking jump shots. Let the record show, TRO hates jump shots.
1 Thanks, Gramma!
2 SRS = Simple Rating System, which takes point differential and strength of schedule into account.
3 At his current rate of playing in 96% of possible games, TT will play in his 787th game exactly 820 games from today.
4 TT’s FT%, Y = 0.000484237 * games + 0.522408001
5 Take it to the hole, Dion. Seriously.

I’m liking Delly. But you can’t rely on him to carry the team.
I suppose I should re-phrase my Dellavadova critique after his performance tonight. Bottom line, its sad when the only guy playing hard is a guy who clearly does not have the ability that everyone else does. It’s great that he is trying, but we are in a world of hurt if he is earning real minutes.
i don’t understand the dellavadova love. i literally have yet to see him get all the way to the rim. he can’t beat anyone off the dribble. plays hard, but can’t see how he will stay in the league.
Mike Brown instills a difficult defensive system, and it has historically taken his teams awhile to figure it out and buy in. When you have a team as young as ours, AND that team wasn’t required to play much defense in previous season(s), the learning curve is going to be more steep.
It’s been ugly, but there’s no doubt in my mind we’ll be vastly improved by the end of the season.
Also, Bennett for Asik? Get real.
I think the Cavs investment in Bynum precludes them from targeting Asik. But in general, too early to panic regarding the Cavs.
I’m confused, should this post have made me more or less likely to support a panic trade of Anthony Bennet for Omer Asik?
Nothing like 3 days off to get the playoff talk juices flowing again!
Well if the East standings hold to form (Indy, Miami, Chicago, and a flaming pile of crap), then consistently competitive after the New Year may be all that it takes to land this young squad’s first playoff berth.
Good stuff, Tom. Particularly enjoyed the chart demonstrating Mike Brown’s history of slow starts. Now that they are actually practicing offense (still can’t believe this!), if they can even become league average on offense while maintaining their gains on the defensive end of the floor, then they are going to be just fine this year.
Thanks, Ross. Mike Brown has his work cut out for him. He’s overflowing with young, unproven players that are clearly not comfortable playing off each other. It has to get better – right now guys are throwing 4′ passes out of bounds. I don’t even think they need to be league average on offense, just not 2nd last. Also, they have some players extremely skilled at offensive rebounding (mainly Tristan and Andy). There is no excuse for them to be hoisting contested mid-range jumpers off the dribble. They should be attacking the basket (even if it’s forcing the issue), and… Read more »
Tristan’s improvement at the line has been extremely unorthodox and he’s finally starting to get some national recognition as a solid young player rather than a bust. Amazingly in just 153 games Thompson has already missed more free throws than Price did in nine seasons in Cleveland (213-195).
@Cory – Tristan’s effectiveness at the free throw line is going to pay off big time. All the loose ball fouls he’s going to be drawing, not to mention the times teams are just going to hack him to prevent a dunk. He’s gradually transformed from a liability to an asset at the stripe. I can’t think of any comparable example to this.